When you purchase through the links on my site, you support the site at no extra cost to you. Here is how it works.
I think of analyzers as a second opinion, something that confirms or challenges what you’re hearing, especially in rooms that aren’t perfectly treated. They won’t fix anything for you, but they’ll show you exactly where the problems live so you can make faster, more confident decisions with your EQ, your compression, even your arrangement.
From what I can tell, the spectrum analyzer category has gotten significantly more interesting over the past few years. Some plugins show you a simple frequency curve, while others layer in auditory masking models, dynamic range distributions, or multi-track overlays that completely change how you approach a mix.
This list covers 11 options across both paid and free tiers, and honestly, several of the free ones here punch well above what you’d expect for the cost of nothing.
1. schulz.audio Spectrum 2
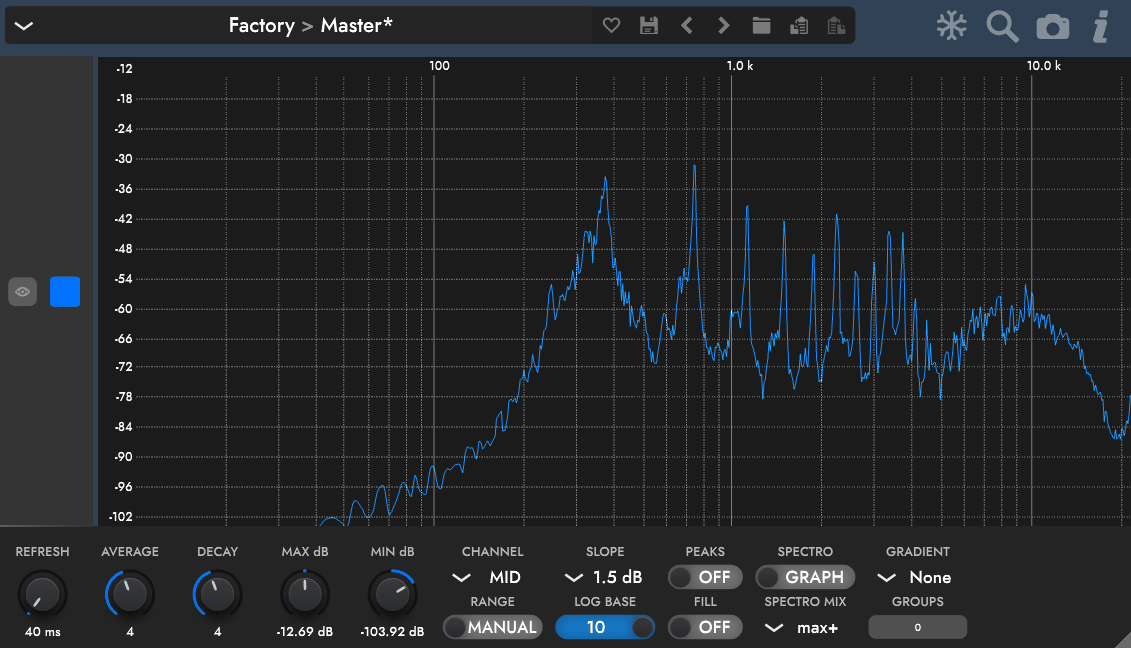
schulz.audio Spectrum 2 solves a routing problem that most multi-channel analyzers don’t even acknowledge. In a typical setup, if you want to compare the frequency content of your kick, bass, and vocal on one screen, you’d need to set up sends, buses, or some other workaround that eats time and clutters your session.
Spectrum 2 skips all of that. You drop an instance on each track you want to monitor, and the instances automatically discover each other with zero routing configuration. The display populates itself, each channel gets its own color, and you’re looking at a layered frequency picture of your mix in seconds.
What stands out to me is how practical that makes the whole workflow. If your DAW supports it, each instance picks up the track name and color automatically, so you’re not squinting at unlabeled curves trying to remember which line belongs to which instrument.
- Spectrogram and Spectrograph
These two display modes serve different purposes and it helps to understand when each one matters. The spectrograph gives you the standard real-time frequency curve that most producers are familiar with, useful for spotting peaks and frequency collisions as they happen. The spectrogram rolls time along the vertical axis, painting frequency content over time so you can see sustained resonances, frequency buildup, or how a sound evolves across a passage.
I found that switching between the two during different stages of a mix gives you a much more complete picture than sticking with one mode alone.
- Variable Block Size
You can set the FFT block size anywhere from 2k to 16k samples, which directly controls the tradeoff between frequency resolution and time responsiveness
- Freeze and Screenshot
Being able to freeze the display and capture screenshots directly from the plugin is one of those small workflow features that ends up saving more time than you’d expect.
Personally, I think it’s especially useful during mastering when you want to compare the spectral profile of different sections of a song without having to keep everything running in real time.
- Musical Note Display
Instead of reading frequency values in Hz only, Spectrum 2 can show you the corresponding musical note alongside the frequency readout.
2. Voxengo SPAN (Free)
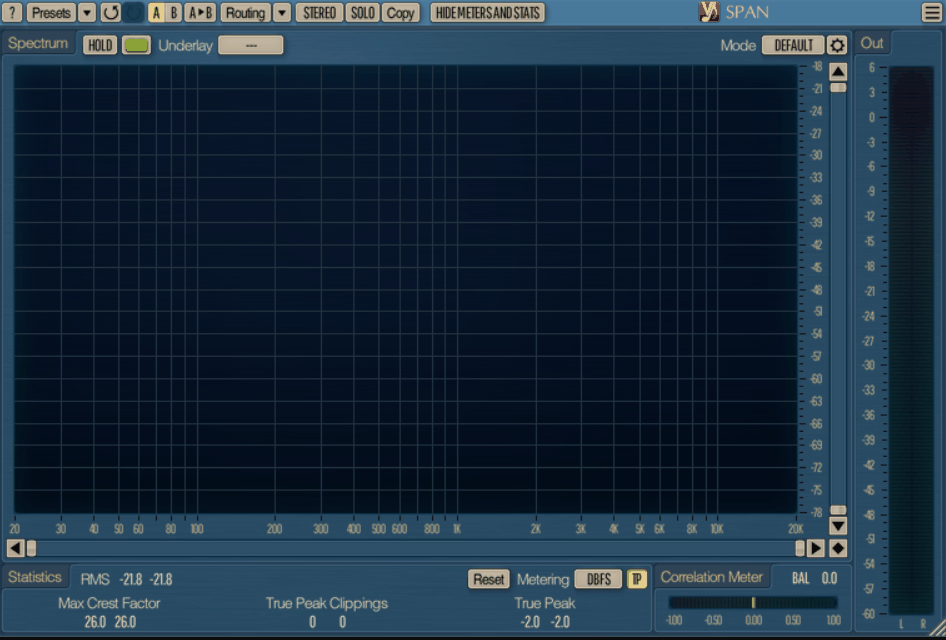
There’s a reason this plugin shows up in almost every mixer’s default template, and it isn’t because of flashy graphics or a trendy interface.
I believe what keeps people reaching for Voxengo SPAN is that it handles the fundamentals of spectrum analysis with a level of configurability that most paid analyzers can’t touch.
The mode system alone is worth understanding: you choose your FFT block size, overlap percentage, visual slope, and what your secondary spectrum shows (real-time max, all-time max, average), and then save that whole configuration as a reusable preset.
I’m a big fan of how that mode system works in practice. Instead of a single “one size fits all” display, you can build separate presets for different tasks. One preset might be set up for low-end inspection with a large block size and a heavy slope, while another might be tuned for quick mastering checks with tighter smoothing.
- EBU R128 and K-System Metering
SPAN goes well beyond basic spectrum display by including full EBU R128 LUFS/LU metering and K-system metering with calibration support
- Stereo Correlation Meter
The built-in correlation meter gives you a real-time readout of the phase relationship between your left and right channels. A reading near +1 means strong mono compatibility, while anything drifting toward 0 or negative warns you that elements may cancel or thin out on mono playback systems.
I noticed that having this visible alongside the spectrum, without opening a separate plugin, changes how often you actually check it. When it’s right there, you catch phase issues earlier.
- Secondary Spectrum Display
You can layer a secondary spectrum on top of the primary one, which is something I feel like a lot of people overlook. The secondary trace can show an all-time maximum, real-time maximum, or an average reading, giving you context about the overall frequency envelope of a mix even while the primary curve is bouncing around in real time.
It’s a practical way to spot whether a peak you’re hearing is a momentary spike or a persistent buildup.
3. Excite Audio VISION 4X
Most analyzers give you one or two ways to look at your signal, and you work within those constraints.
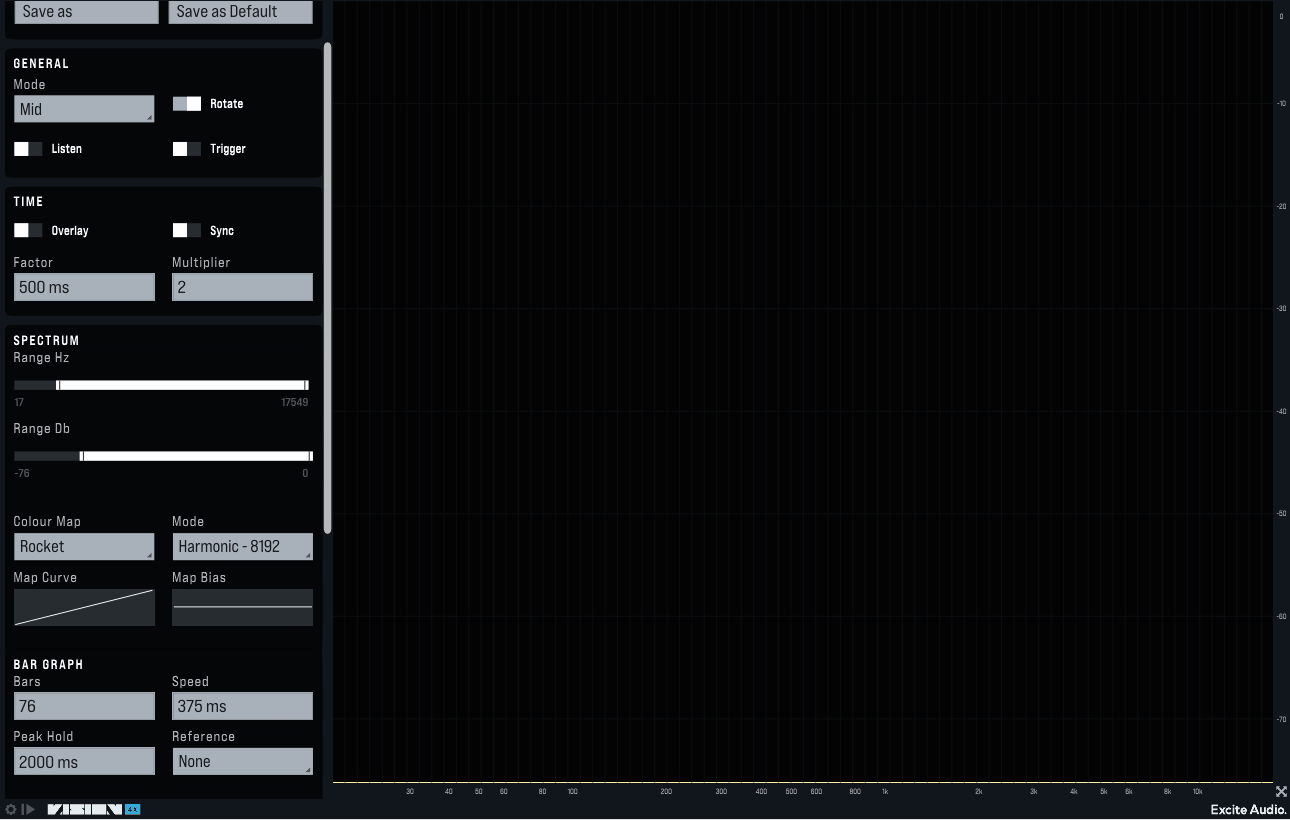
Excite Audio VISION 4X was built from the ground up around the idea that you should see four separate views simultaneously: a spectrogram, a bar graph, a waveform display, and a phase correlation meter, each in its own panel, each running in real time. The plugin was developed in partnership with Noisia, and you can feel that influence in how the tool prioritizes density of information without clutter.
- Reference Curves
VISION 4X ships with 17 reference curves generated from analysis of hundreds of tracks across multiple genres. Each curve includes both an average and a maximum value line, and frequencies that overshoot the reference appear highlighted in red.
- Spectrogram Modes
The spectrogram has three distinct visualization modes. Transient mode emphasizes the attack and release characteristics of sounds, which is useful when you’re trying to understand how a snare or a pluck behaves over time.
Harmonic mode digs deeper into the sustained tonal content of a signal, revealing overtone structures and resonances more clearly. All-round is the general-purpose setting for everyday mixing.
Each mode also works with 10 color maps that aren’t just aesthetic choices. They’re designed for maximum information density, and you can bias the brightness toward low or high frequencies using the Map Bias control.
- Spectrum Highlight
The bar graph includes a Spectrum Highlight function that identifies and visually flags resonant frequencies. You can adjust its sensitivity and match the color coding with your spectrogram settings
- DAW Sync and Looping
Being able to sync the entire analysis window to your DAW’s transport and loop sections with overlaid data is something that sets VISION 4X apart from most competitors
- Waveform Analyzer
The built-in waveform view lets you zoom in on the actual shape of your audio signal at a level that most DAW meters can’t reach
- Noisia Presets
The plugin includes presets designed by Noisia that configure all four panels for specific mixing and mastering tasks
4. Blue Cat’s FreqAnalyst
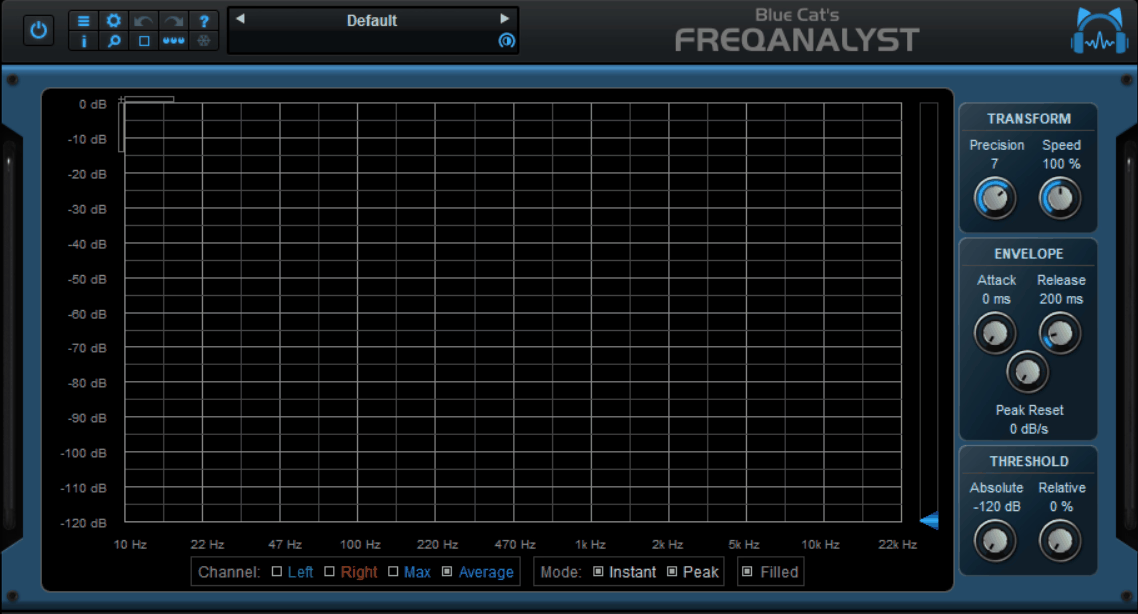
Blue Cat’s FreqAnalyst is one of those plugins that does exactly one thing and does it without any bloat or learning curve. It’s a real-time mono and stereo spectrum analyzer, free, and it focuses entirely on delivering a clean, readable frequency display.
In general, I think there’s real value in that restraint. Not every session needs a multi-panel diagnostic suite, and sometimes you just want to glance at a frequency curve to confirm what your ears are telling you.
The thing that makes FreqAnalyst feel noticeably different from other basic analyzers is its interpolation algorithm. Where many free spectrum tools produce a jittery, flickering curve that’s hard to read at a glance, FreqAnalyst smooths the display in a way that preserves detail without the visual noise.
- Transparent Overlay
This is the feature that I feel like I should mention first, because it genuinely changes how you use the plugin. You can make the FreqAnalyst window partially or fully transparent and overlay it on top of your DAW’s mixer, arrange window, or another plugin entirely. That means you can watch the spectrum while adjusting an EQ or compressor without switching windows.
In addition to that, it works with the skinning language Blue Cat provides, so you can redesign the whole interface if the default look doesn’t suit you.
- Threshold System
FreqAnalyst uses a dual threshold approach with both absolute and relative thresholds. The absolute threshold sets a floor below which frequency content is hidden, cutting visual clutter from noise or very low-level signals. The relative threshold adjusts how much of the spectrum is shown relative to the peak, which is helpful for focusing on the loudest elements.
5. FabFilter Pro-Q 4
When it comes to Pro-Q 4 is technically an equalizer, and a very good one, but the built-in spectrum analyzer alone would be worth discussing even if the EQ didn’t exist.
What makes it unique in this context is that the analyzer and the EQ are not separate features sitting next to each other. They’re integrated so deeply that the analyzer actively informs how you interact with the EQ, and vice versa.
You can grab a peak directly in the spectrum display and drag it into a filter node. That feature, Spectrum Grab, is the kind of thing that sounds gimmicky until you actually use it and realize it shaves significant time off surgical EQ work.
- Spectral Dynamics
This is the feature that pushed Pro-Q 4 past its predecessor in a meaningful way. In Spectral Dynamics mode, the plugin creates fine-grained dynamic bands within a containing EQ band. Instead of compressing or expanding an entire frequency region, it targets only the specific frequencies within that region that cross the threshold, leaving everything else untouched.
In practice, this is extremely effective for taming harsh resonances that shift around in frequency, something a static notch filter handles poorly. The display shows you exactly which micro-frequencies are being affected in real time, turning the analyzer into a fully interactive diagnostic and treatment tool in one view.
- EQ Match
The EQ Match function lets you capture the spectral profile of one signal and apply that shape to another. You can match against a reference track, another Pro-Q 4 instance in the session, or an external sidechain signal
- Display Range Options
Pro-Q 4 offers four display ranges: 3 dB and 6 dB for mastering work where small adjustments matter enormously, and 12 dB and 30 dB for mixing where you’re making broader moves.
- Collision Detection
When multiple Pro-Q 4 instances are active, the analyzer can show you where their frequency curves overlap. This visual collision detection highlights areas where two or more tracks are competing for the same spectral space, which is essentially the core problem that mixing is trying to solve.
6. Plugin Nation SpectrumNation
Getting a clear view of your sub-bass content is a persistent challenge, and for the most part, a lot of spectrum analyzers treat the region below 100 Hz as an afterthought.
The low end gets compressed into a narrow strip on the left side of the display, and you’re left guessing where your kick fundamental sits relative to your bass. It’s a real limitation in genres where sub-bass precision matters.
SpectrumNation comes with an 8192-point FFT engine that prioritizes resolution in exactly that range.
- Sub-Bass Resolution
The 8192-point FFT engine gives SpectrumNation significantly more detail in the sub-bass and low-frequency regions compared to analyzers running smaller FFT sizes. In practice, this means you can see individual notes in the sub region rather than a vague blob of energy. If you produce music where the kick and bass relationship below 60 Hz defines the track, this resolution is the difference between guessing and knowing.
- Dual Viewing Modes
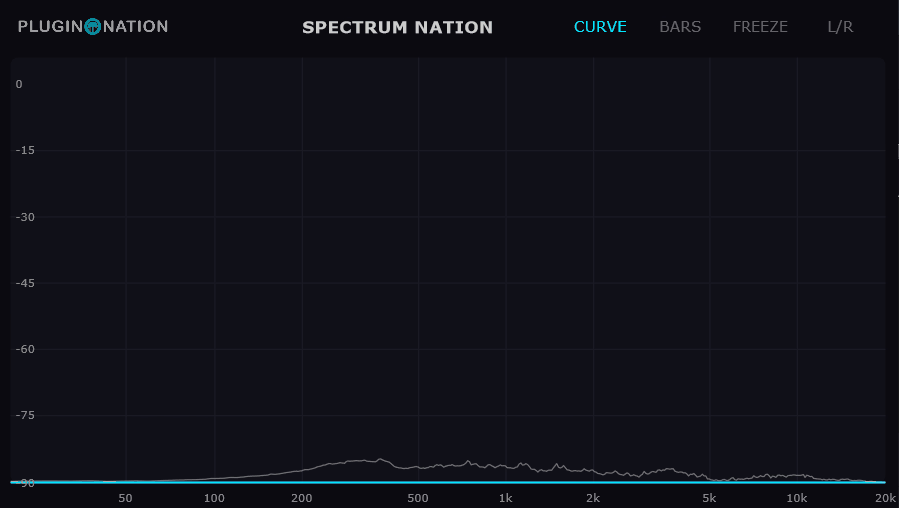
You can switch between a Bar mode and a Smooth Curve mode depending on how you prefer to read frequency data. The bar display is useful for quick visual scans of relative energy across bands, while the smooth curve gives a more traditional analyzer look for people used to tools like SPAN. I’d recommend trying both on the same material, because each mode reveals different things about the same signal.
- Visual Design
SpectrumNation uses a deep dark interface with cyan and pastel purple accents, and it’s designed specifically to reduce eye strain during extended sessions.
It sounds minor, but during long mixing days when you’ve been staring at analyzer displays for hours, the color palette and contrast choices actually matter. Basically, it’s built for producers who keep their analyzer open all the time, not just for quick spot checks.
7. LSP Spectrum Analyzer x1
Open-source audio tools sometimes get dismissed as rough around the edges, and to be fair, that reputation is sometimes deserved. But something different is happening with the Linux Studio Plugins project.
LSP Spectrum Analyzer x1 is a single-channel analyzer that belongs to a larger plugin suite developed by Vladimir Sadovnikov, and it packs a surprising amount of analytical depth into a free, open-source package.
The plugin doesn’t just show you a frequency curve and call it done. It offers four distinct modes: Analyzer for straightforward spectral display, Mastering for a broader, more visually intuitive overview, Spectralizer for scrolling spectrogram views, and Freeze for locking the display in place.
- Inspect Mode
When you enable Inspect, the plugin applies a real-time bandpass filter to the audio output based on where you position the frequency slider on the graph.
- Spectrogram Rendering
The Spectralizer mode offers multiple rendering styles for its spectrogram. Rainbow mode shifts color hue based on signal amplitude, Fog mode adjusts transparency, and Color mode changes saturation. Each one prioritizes a different visual dimension of the same data.
- Gain and Preamp Controls
Each channel has individual Shift gain adjustment and a global Preamp control, which lets you calibrate the display to match the actual signal level you’re working with
- Reactivity Control
The Reactivity slider adjusts how quickly the display responds to changes in the input signal. Faster settings capture transients and quick changes accurately, while slower settings smooth the display for a more averaged reading. At the core of it, this is a fundamental tradeoff that every spectrum analyzer makes, but LSP gives you direct, granular control over it rather than burying it behind preset modes.
8. SIR Audio Tools Spectrum Analyzer
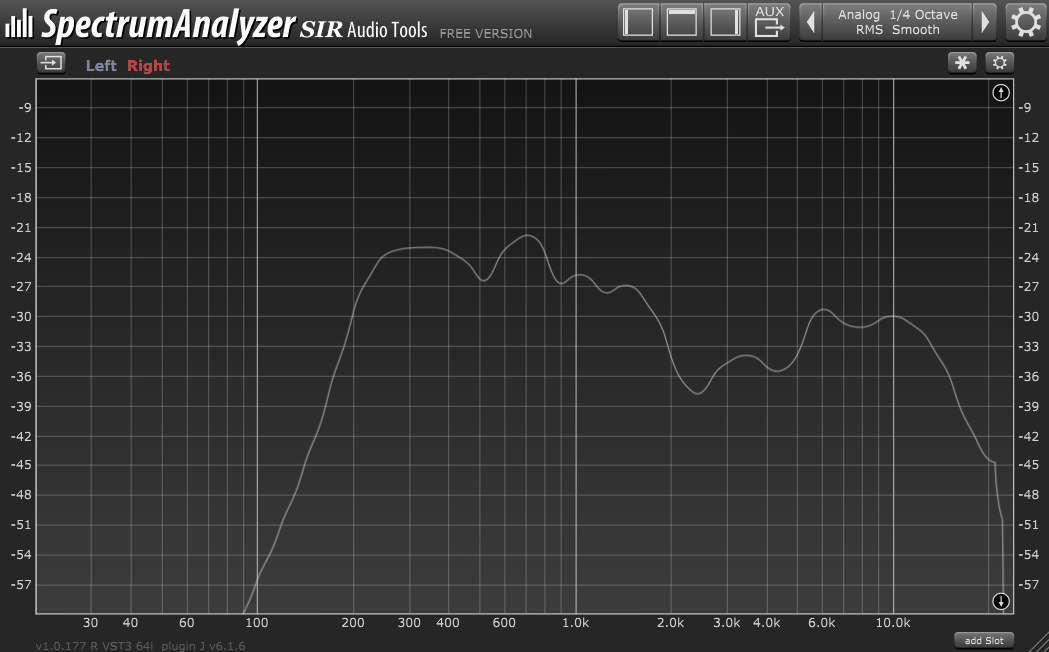
What typically happens with spectrum analyzers is that you get either an FFT-based engine for precise frequency resolution or a bandpass filter approach for better time accuracy, but not both. SIR Audio Tools Spectrum Analyzer runs both engines simultaneously, and I’d say that dual-engine design is the single most important thing to understand about this plugin.
The FFT engine shows you fine spectral detail, the analog-style IIR bandpass filter engine captures transient behavior more faithfully, and you see both on the same display.
Why does that matter in practice? Because an FFT on its own can smear short transients, making a snare or a click sound like it has sustained spectral energy when it really doesn’t. The bandpass filters respond faster and give you a more honest picture of how percussive elements behave.
Having both views overlaid means you can trust the display for both sustained tonal content and for fast, transient material. The plugin comes in a free edition and a full version, with the free version limited to 2 slots and a maximum of 4 bands per octave on the bandpass analyzer, while the full version opens that up to 4 slots and 32 bands per octave.
- Intelligent Peak Detection
The analyzer automatically identifies and marks resonant frequency peaks in the signal, which saves you the manual work of sweeping a narrow EQ boost across the spectrum. When a peak is genuinely resonant and sustained, the detection highlights it clearly.
This is useful for vocal tracks where resonances shift with pitch, or for room correction work where standing waves create persistent buildups at specific frequencies.
- Auxiliary Multi-Track Viewing
The aux-send system lets you route audio from one Spectrum Analyzer instance into another, so you can compare multiple tracks in a single plugin window without any mixer routing.
Set up instances on your kick, bass, and pad tracks, activate their aux sends, and then switch between them in your master instance. For the most part, this is a faster way to spot frequency collisions between competing elements than toggling between individual plugin windows.
In the full version, you can have up to 4 aux slots open at once, meaning four different sources visible on the same graph simultaneously.
- Snapshot Function
You can save the current state of the analyzer as a snapshot and recall it later for comparison. In my opinion, this is especially valuable for referencing: capture the spectral profile of a commercial master you admire, then compare your own mix against it visually. It’s a manual version of what some plugins automate with EQ matching, but it keeps you in control of the interpretation.
- VU Meter and Correlation
Built into the same interface, the VU meter provides both peak and RMS measurement, and the stereo correlation meter shows the phase relationship between your left and right channels. Having these alongside the spectrum display means you don’t need a separate metering plugin for basic level and stereo checks, which keeps your plugin count manageable and your CPU lighter.
9. TDR Prism
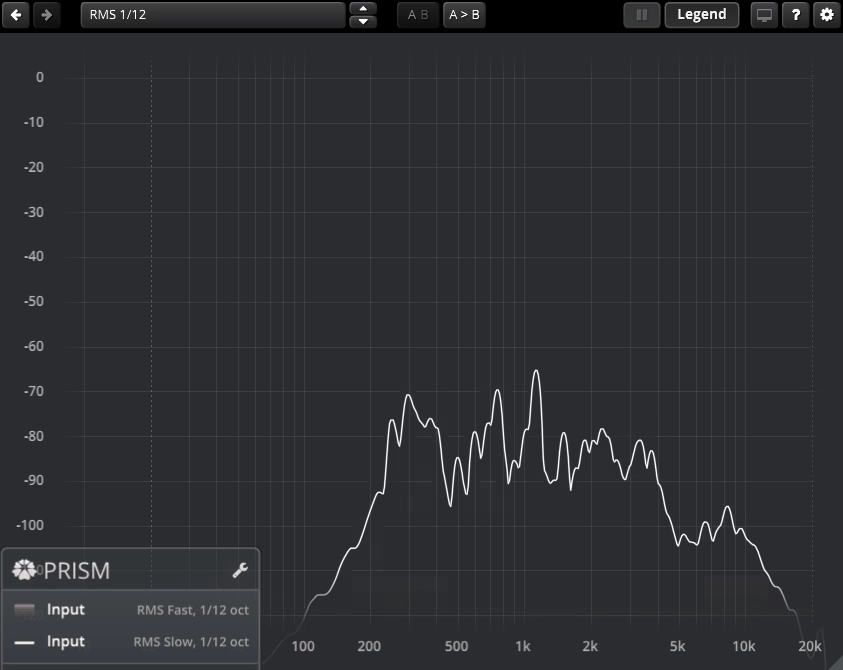
Most spectrum analyzers show you what’s happening in the frequency domain based on raw signal measurements. In contrast, TDR Prism starts from the question of what those frequencies actually sound like to a human listener.
Tokyo Dawn Labs designed this free analyzer around a human auditory model that accounts for how our ears perceive frequency energy differently across the spectrum, and it includes real-time auditory masking indication that shows where one sound is perceptually hiding another.
- Spectral Weighting and Tilting
Prism offers a wide range of weighting curves and tilting options that go beyond the standard A-weighting or pink noise slope found in most analyzers.
You can shape the display to approximate how human hearing responds at different loudness levels, which means the visual representation more closely matches what you’re actually perceiving. For example, at low monitoring volumes, our ears are less sensitive to bass and treble. Applying the appropriate weighting reflects that reality on screen.
- Multi-Source Comparison
You can pull in spectra from sidechain inputs, external audio files, or even other Prism instances within the same project. This makes A/B referencing incredibly straightforward. Load a reference master as an audio file, route your mix into the main input, and compare both spectra on the same display without leaving the plugin.
I believe this is one of the cleanest implementations of reference comparison in any free analyzer available.
- Tone Generator and Markers
Prism includes a built-in tone generator with multiple modes, including static sine, dynamic sine, dynamic noise, and bandpass options. This is useful for calibrating your monitoring setup or testing how your room responds to specific frequencies.
The automatic marker lines and screen magnification make it easy to zoom into a region and read precise values without losing context of the broader spectrum.
10. Bakuage DRAnalyzer (Free)
Standard spectrum analyzers give you a snapshot of what’s happening right now, a single curve bouncing in real time. That’s useful, but it throws away all the information about how that spectrum varies over time.
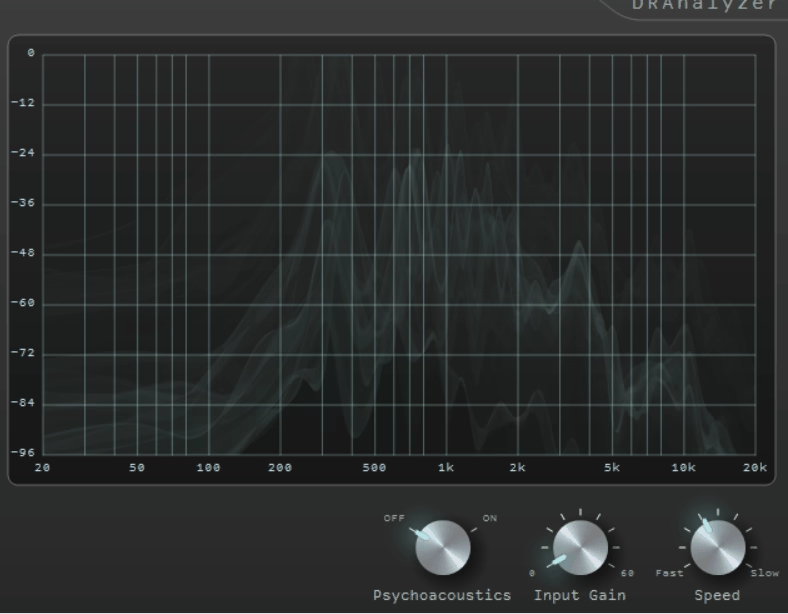
The approach that Bakuage DRAnalyzer takes is genuinely different: instead of showing you only the instantaneous spectrum, it displays past spectrums as a distribution, building up a visual record of how the spectral content has varied.
- Distribution View
The core feature is the spectral distribution display, which accumulates past analysis frames and shows them as a layered visual. Peaks that appear briefly leave a light trace, while sustained energy creates denser visual concentrations.
At first glance, it looks more like a spectrogram than a traditional curve, but the purpose is different: it’s specifically designed to reveal dynamic range per band, not just frequency content over time. No other free analyzer I’ve found approaches visualization this way.
- Multiband Compressor Pairing
Because DRAnalyzer reveals the dynamic behavior of each band, it pairs naturally with multiband compressors.
You can place it before your compressor to see which bands actually need dynamic treatment, set your crossover points and ratios based on real data, and then place another instance after to verify the results. It’s a feedback loop that removes guesswork from multiband processing.
- Auditory Correction
The optional human auditory characteristic correction reshapes the displayed spectrum to reflect how sensitive our ears are at different frequencies. Without this correction, you might see substantial energy at 40 Hz and assume it’s dominating the mix, when in reality, human hearing is much less sensitive at that frequency. Enabling the correction puts the visual representation in line with perception, which leads to better mixing decisions.
11. Seven Phases Spectrum Analyzer (Free)
Most modern spectrum analyzers lean on FFT algorithms, and for good reason: FFT gives you excellent frequency resolution across the entire audible range.
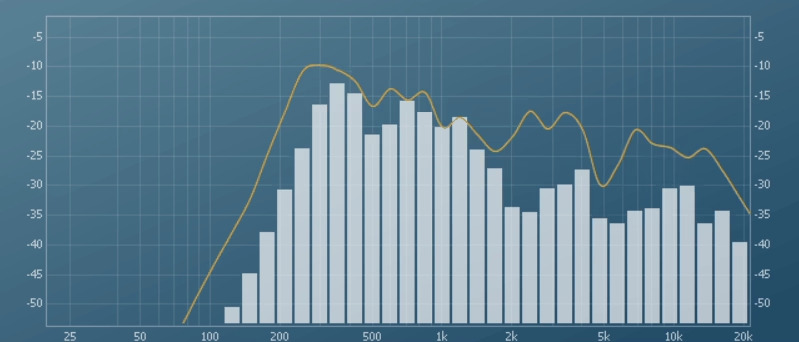
But Seven Phases Spectrum Analyzer deliberately goes the other direction, using a filter-bank approach instead. This is the same method that classic hardware spectrum analyzers used, and it brings a fundamentally different set of strengths and tradeoffs to the table.
The biggest practical difference is in time response. Filter-bank analyzers tend to react to transients more quickly and naturally than FFT-based tools, which means the display tracks the energy of percussive hits with less smearing. On the other hand, you’re working with a fixed number of bands rather than a continuous frequency curve, so the frequency resolution is inherently coarser.
- Display Modes
You get three visual styles: Bar, Curve, and Curve Fill. Bar mode gives you the classic hardware analyzer look, with individual vertical bars representing each frequency band. Curve mode connects those data points into a smooth line, and Curve Fill fills the area under the curve, which I found makes it easier to compare the overall shape of two different signals.
Each mode has a different feel, and it’s worth switching between them depending on whether you’re doing broad tonal evaluation or trying to track specific bands.
- Simultaneous Peak, Hold, and RMS
The display can show peak, peak-hold, and average (RMS) values simultaneously. Peak shows the maximum energy at any given moment, peak-hold freezes the highest peak reached until reset, and RMS gives you the averaged energy level over time. Seeing all three at once is especially helpful for understanding the crest factor of your signal, the difference between the loudest peak and the sustained average.

Hey, I’m Vil, I started this site to help you find the best audio plugins covering various categories including synths, pianos, strings, and effect tools of all sorts as well. I pick these plugins based on various criteria so it best matches the actual topic.